England’s most deprived areas have been revealed in official government data released only once every five years.
The English Indices of Deprivation, compiled by the Ministry for Housing, Communities and Local Government (MHCLG) ranks every neighbourhood in the UK from most to least deprived.
Researchers look at multiple measures of deprivation, including: income, education, health, crime, barriers to housing and services, and the environment. These are combined into one overall score.
Jaywick, near Clacton-on-Sea in Essex, has been named England’s most deprived neighbourhood for the fourth consecutive time since 2010, the data shows.
The area sits within the Clacton-on-Sea constituency, which elected Nigel Farage as its MP in 2024. The Reform leader said it was “obviously sad that things aren’t improving more quickly” and, while he felt he had helped with investment and tourism for the area, added “there’s a limit to what one person can do”.
Seven neighbourhoods in Blackpool also rank among the ten most deprived, with researchers finding it to be England’s most deprived local authority area overall.
However, half of the neighbourhoods in Middlesbrough were found to be very deprived, making it the council with the highest proportion, followed by Birmingham and Hartlepool.
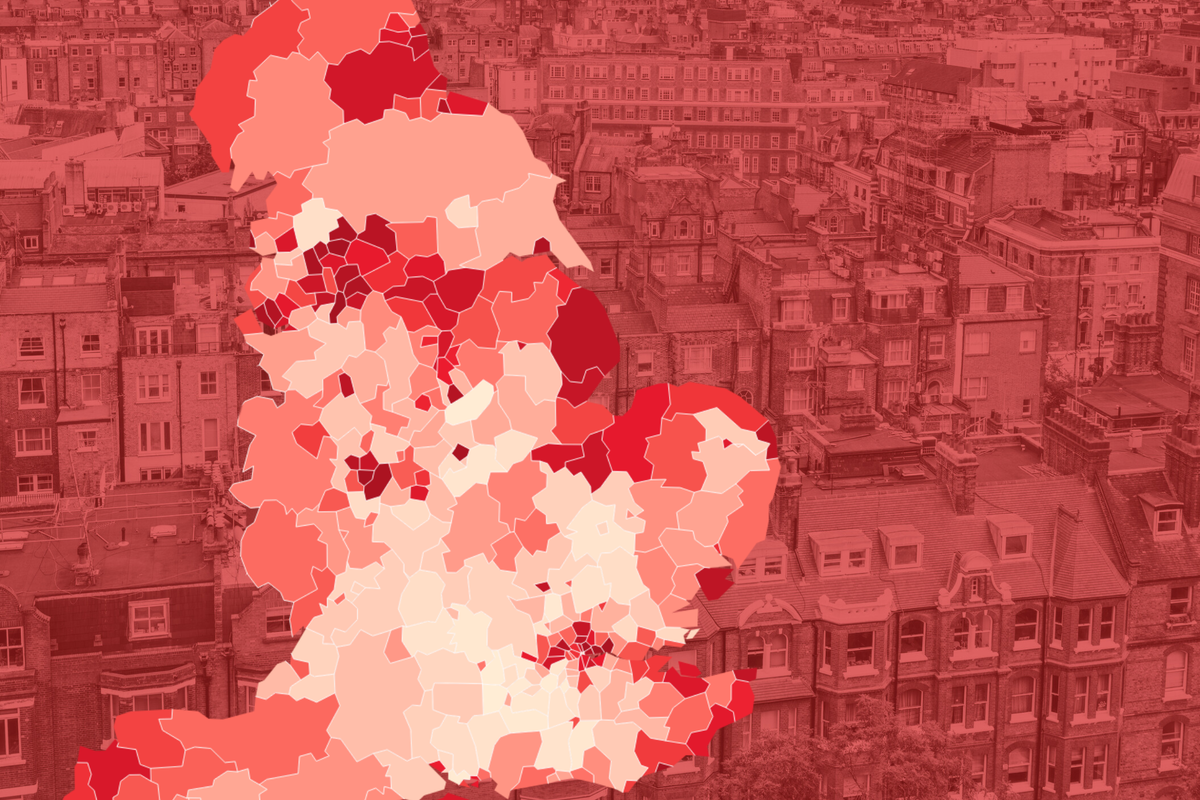
Use The Independent’s interactive maps to find out how every council compares:
