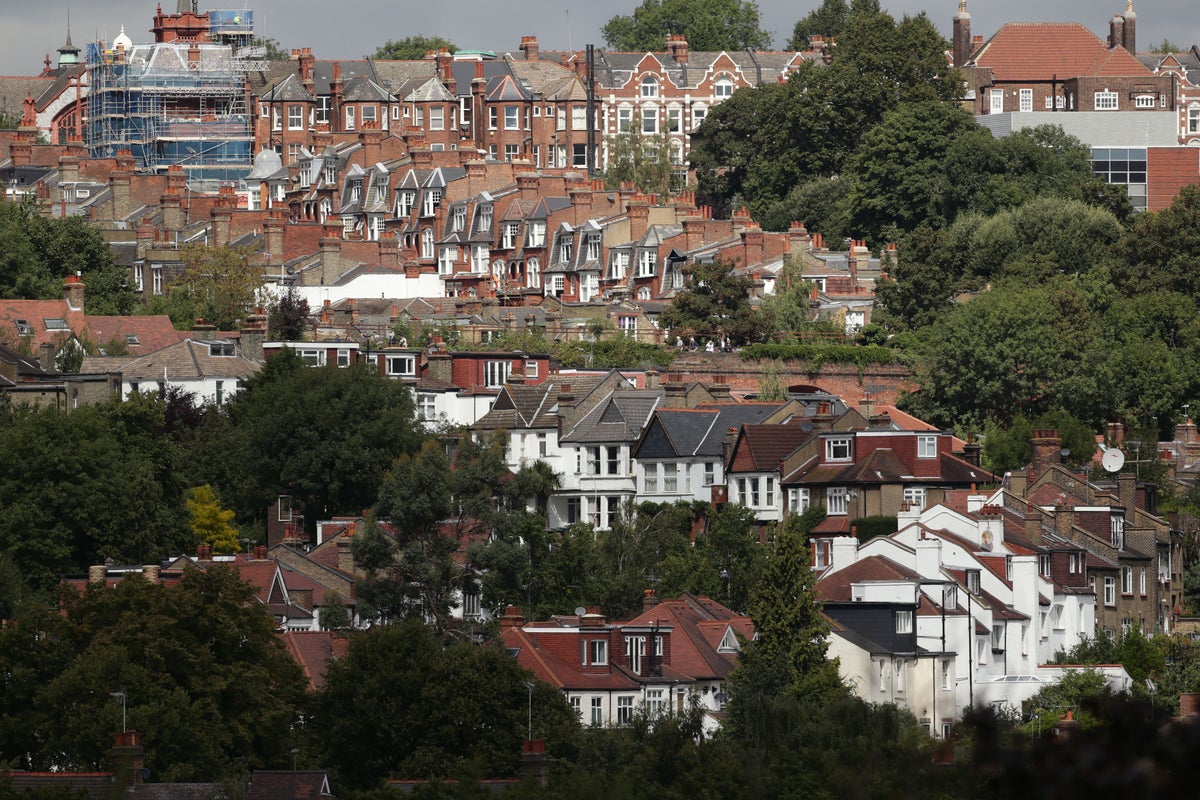
The extent to which house prices have soared across the UK over the past two decades has been revealed in new data – but some areas have seen far larger rises than others.
According to property website Zoopla, house prices have leapt by an average of 74 per cent since 2005, adding more than £150,000 to the average property value.
That means the average property price has risen from £113,900 to £268,200 over the past 20 years.
However, sharper rises in some areas could mean that people are priced out of buying a home in the area they grew up in.
The largest property price increases have been in London, with the cost of homes in the capital more than doubling since 2005, according to Zoopla. In the South East and East England, property values have also risen by 87 per cent.
By contrast, house prices in North East England have risen by 39 per cent during the same period. In Blackpool, average house prices have increased by 26 per cent, while in Sunderland they have risen by 22 per cent.
Scotland and Wales both saw similar levels of price increases – of 63 and 64 per cent, respectively – bringing average property prices to £168,000 north of the border, and to £206,500 in Wales.
The map below shows the increases in average house prices over the past 20 years, according to Zoopla. Figures show the average house price in 2005 followed by the average house price in 2025, and the percentage increase over the past 20 years:
To calculate the increases, Zoopla used its house price index, comparing the difference between average house prices in April 2025 and April 2024, as part of its research.
It also commissioned an Opinium survey among 2,000 people across the UK in June, which indicated that 52 per cent of people in the UK would consider moving back to the location where they grew up.
“If you grew up in north-east England, bought in London and are now returning to your roots, you’re in luck,” said Tom Bill, head of UK residential research at Knight Frank.
“You will get significantly more bang for your buck and the equity accumulated means your mortgage could be wiped out altogether. The gap between the capital and the rest of the country has narrowed in recent years as more affordable parts of the UK have seen stronger house price growth.
“The squeeze in London means more buyers are looking beyond the M25, and that often includes locations where they have roots, a trend that was accelerated by the pandemic and shifting work patterns.”
The following map shows the local authority areas with the biggest house price increases over the past 20 years in each region or nation as broken down in the previous map, excluding Northern Ireland, according to Zoopla:
And here are the local authority areas with the lowest house price increases over the past 20 years in each region or nation, excluding Northern Ireland, according to Zoopla:
Daniel Copley, a consumer expert at Zoopla, said: “Our latest analysis certainly brings to light the profound impact that two decades of house price growth has had on the dream of ‘returning home’.
“UK house prices have soared by 74 per cent since 2005, making that nostalgic return financially unattainable for many, especially in hotspots in the South East and eastern England.
“However, the picture is far from uniform across the UK. Our data shows that while some areas have seen dramatic increases, house prices have risen slowly, in line with incomes in northern regions. This means that for some, the dream of returning to their roots might be much more attainable than they think.”
